Understanding IV Rank for Options Selling
Disclaimer: All ticker prices, premiums, and return calculations shown are examples for educational purposes and reflect market conditions at the time of writing. They are not trade recommendations. Options trading involves significant risk of loss. Past performance of any strategy does not guarantee future results. Consult a licensed financial professional before trading.
Learn what IV Rank is, how it's calculated, and why it's the #1 filter for identifying when options premium is rich enough to sell.
The Mechanics
IV Rank (Implied Volatility Rank) measures where a stock's current implied volatility sits relative to its own historical range over the past 52 weeks. It answers a simple but powerful question: is this stock's IV high or low compared to where it's been?
The Calculation
The formula is straightforward: IV Rank = (Current IV - 52-Week Low IV) / (52-Week High IV - 52-Week Low IV) x 100. If a stock's IV has ranged from 20% to 60% over the past year and current IV is 50%, the IV Rank is (50-20)/(60-20) = 75. This means current IV is higher than 75% of readings over the past year.
IV Rank vs IV Percentile
IV Rank and IV Percentile are often confused but measure different things. IV Rank compares the current value to the range (min to max). IV Percentile tells you what percentage of days in the past year had lower IV than today. If IV spiked to 100% for one day and averaged 30% the rest of the year, a current reading of 40% would have a high IV Percentile (most days were below 40%) but a low IV Rank (40% is near the bottom of the 30-100 range). Both are useful, but IV Rank is more commonly used for options selling decisions because it highlights when the premium is meaningfully elevated relative to the stock's full range.
Why Absolute IV Is Misleading
A stock trading at 45% IV might look like it has rich options premium — but what if that stock typically trades between 40-80% IV? In that case, 45% IV is near the bottom of the range, meaning premium is actually cheap. Conversely, a stock at 25% IV might seem low, but if its range is 12-28%, current IV is near the top — premium is rich relative to what that stock normally offers. IV Rank normalizes for each stock's unique volatility profile, making it possible to compare selling opportunities across different names.
The Real Edge
IV Rank is widely regarded as the single most important filter for options premium sellers. Professional options traders at firms like Tastytrade have published extensive research showing that selling options when IV Rank is elevated produces significantly better risk-adjusted returns than selling at low IV Rank.
The Statistical Edge
When IV Rank is above 50, you're selling options priced at above-average premium levels. Since implied volatility typically overstates actual stock movement (the volatility risk premium), selling options at elevated IV magnifies this structural edge. You're collecting more premium per unit of risk than you would when IV Rank is low. Over hundreds of trades, this difference compounds meaningfully.
IV Rank and the IV/HV Ratio
IV Rank becomes even more powerful when combined with the IV/HV (Implied Volatility / Historical Volatility) ratio. IV Rank tells you whether premium is high relative to the stock's own history. IV/HV tells you whether the market is overpricing the stock's actual movement right now. A stock with an IV Rank of 80 AND an IV/HV ratio of 1.4 is the sweet spot: premium is historically elevated AND the market is pricing in 40% more movement than the stock is actually delivering. This is where sellers have the greatest statistical edge.
When High IV Rank Is Dangerous
High IV Rank isn't always a green light. IV is elevated for a reason — usually because a binary event (earnings, FDA decision, product launch) is approaching. If the event falls within your options expiration, you're exposed to "IV crush" risk: IV collapses after the event, but the stock may have moved significantly. The key is to sell when IV Rank is high for market-driven reasons (broad fear, sector rotation, macro uncertainty) rather than company-specific binary events. Flow Proof's scanner flags upcoming earnings dates precisely for this reason.
Putting It Into Practice
Flow Proof calculates IV Rank using 365 days of daily ATM (at-the-money) implied volatility observations stored in its scan results cache. Each day the scanner runs, it records the ATM IV for every stock in the watchlist, building a historical dataset that powers the IV Rank calculation.
How the Calculation Works in Practice
The scanner pulls the current ATM IV from the options chain (using the 20-45 DTE expiration that best represents the stock's near-term IV), then compares it against all stored daily readings over the past year. A minimum of 10 data points is required before IV Rank is displayed — this prevents misleading readings from insufficient history. As the database builds over weeks and months, IV Rank accuracy improves.
IV Rank in the Setup Score
IV Rank is the highest-weighted component (28%) in Flow Proof's composite setup score. When IV Rank is available, it replaces the less accurate absolute IV percentage as the primary IV signal. Stocks with IV Rank above 80 receive the maximum IV score (100 points). Stocks below 20 receive the minimum (22 points). This weighting ensures that the scanner naturally surfaces the best premium-selling opportunities at the top of the list.
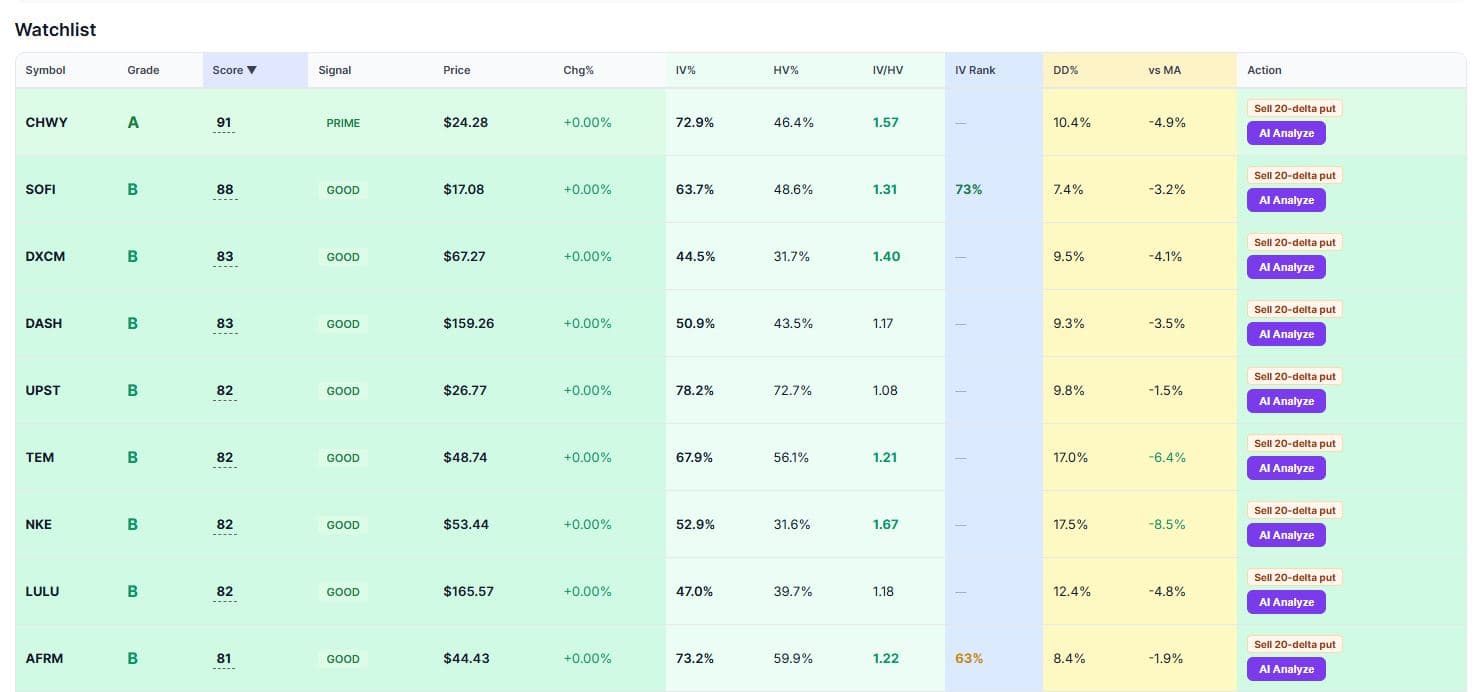
The Color-Coded Display
In the scanner table, IV Rank is displayed with color coding for quick scanning: green (70+) means premium is historically rich — prime selling territory. Yellow (30-69) means average premium. Red (below 30) means premium is cheap — avoid selling. This visual system lets you identify the best candidates in seconds without analyzing numbers.
Related Articles
Start Tracking Institutional Flow
7-day free trial. Full access to whale flow tracking, AI-scored conviction signals, automated paper trading, and the put premium scanner. No credit card required.
Start Free Trial →