Cash-Secured Puts: A Premium Selling Strategy
Disclaimer: All ticker prices, premiums, and return calculations shown are examples for educational purposes and reflect market conditions at the time of writing. They are not trade recommendations. Options trading involves significant risk of loss. Past performance of any strategy does not guarantee future results. Consult a licensed financial professional before trading.
Learn how cash-secured puts work, when to sell them, and how IV Rank and whale flow help time entries for better premium capture.
How It Works
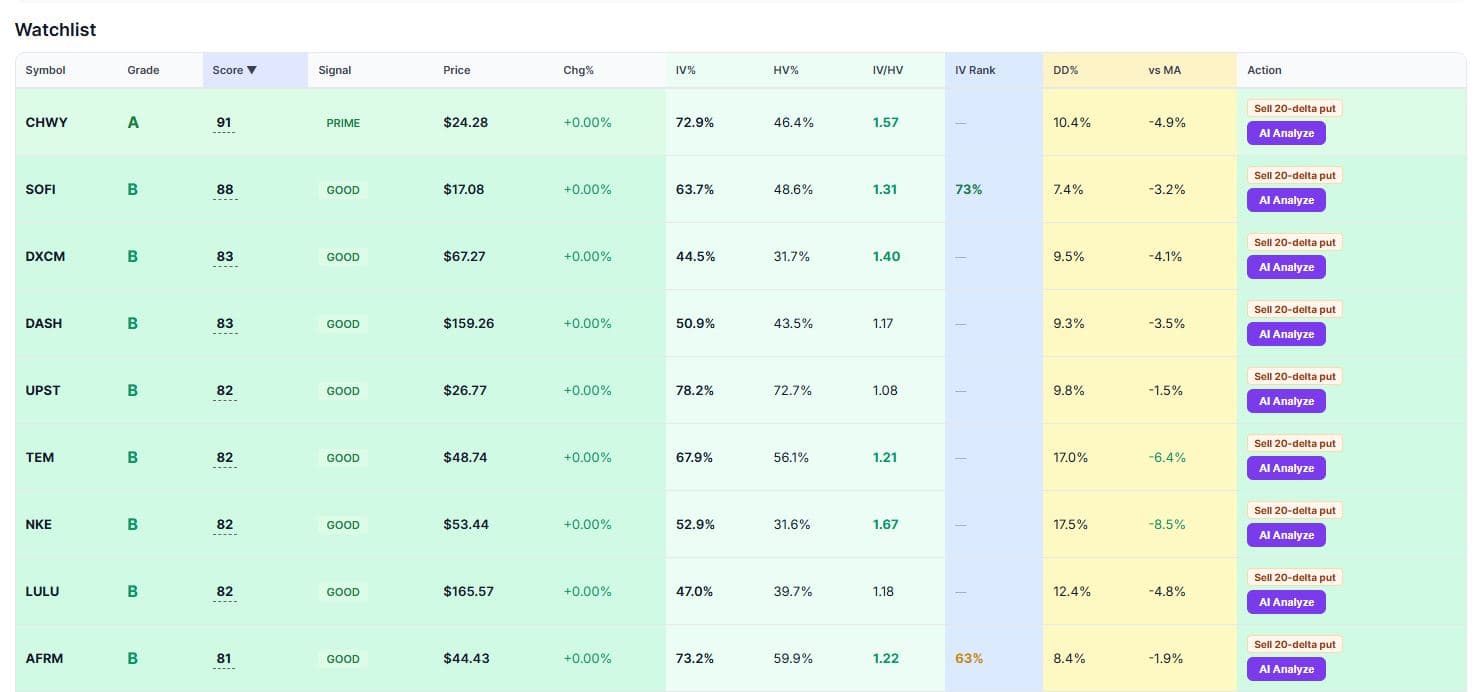
CHWY is at $24.28 with a score of 91 and IV at 72.9%. You sell the $23 put expiring in two weeks for $0.84. If CHWY stays above $23, you keep the $84 per contract — that's a 3.7% return in 14 days. If it drops below $23, you buy 100 shares at an effective cost basis of $22.16 — an 8.7% discount from today's price. Either outcome is fine. That's the setup.
The Mechanics of a Cash-Secured Put
Here's a concrete example. Say SOFI is trading at $14.50 and you sell one $13 put expiring in 30 days for $0.45 per share ($45 per contract). You need $1,300 in cash collateral (the "cash-secured" part). If SOFI stays above $13 at expiration, you keep the $45 premium — a 3.5% return on capital in 30 days. If SOFI falls below $13, you're assigned 100 shares at $13, but your effective cost basis is $12.55 ($13 minus the $0.45 premium collected). You bought the stock at a 13.4% discount to where it was when you entered the trade.
Two Possible Outcomes, Both Acceptable
This is the fundamental appeal of cash-secured puts: both outcomes are profitable if you've chosen the right stock. Either you keep premium income (most likely outcome, since stocks stay above the put strike roughly 70% of the time for well-chosen entries), or you acquire shares of a stock you wanted to own anyway at a below-market price. The worst-case scenario is that the stock drops significantly below your strike — but even then, your cost basis is lower than if you'd bought shares outright.
Key Variables: Strike Selection and Expiration
Strike selection is critical. Selling puts too close to the current price (at-the-money) maximizes premium but increases assignment probability. Selling too far out-of-the-money generates minimal premium that isn't worth the capital commitment. The sweet spot is typically 5-10% below the current price — far enough to provide a margin of safety, close enough to generate meaningful income. Expiration should target 20-45 days out, where time decay (theta) works most aggressively in your favor.
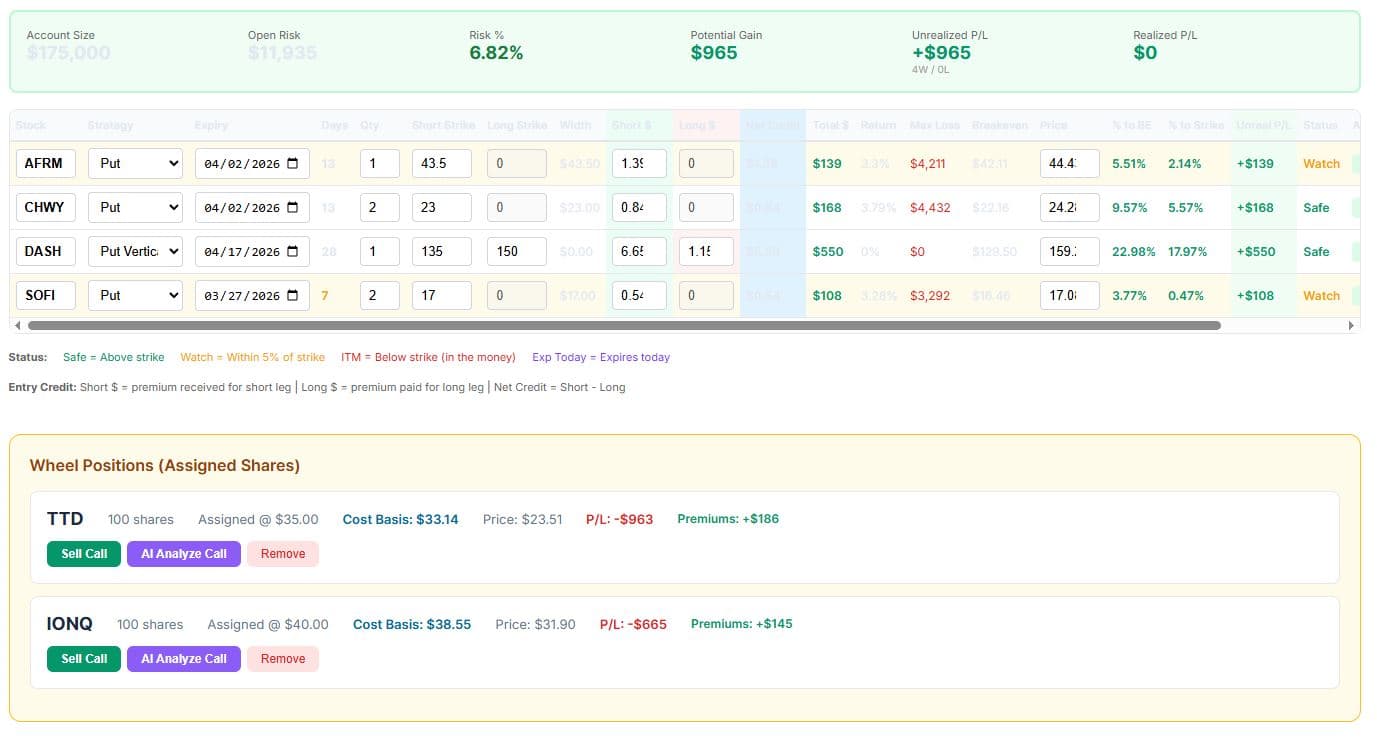
Here's a second scenario: SOFI at $17.08, IV at 63.7%, score 88. You sell the $17 put for $0.54 with 14 DTE. If SOFI holds, you pocket 3.2% in two weeks. If assigned, your cost basis is $16.46 — and you immediately start selling covered calls to reduce it further. Two contracts means $108 in premium on $3,400 of capital commitment.
The Real Edge
Cash-secured puts are one of the most consistently profitable options strategies because they exploit a well-documented market phenomenon: implied volatility typically overstates actual stock movement. This means options are systematically overpriced, and sellers capture that excess premium over time.
The Volatility Risk Premium
Academic research across decades of market data shows that implied volatility exceeds realized volatility approximately 80% of the time. This "volatility risk premium" exists because options buyers are willing to pay extra for downside protection, and market makers price in a margin of safety. As a put seller, you're on the other side of this trade — collecting premium that statistically exceeds the actual risk. Over a large sample of well-chosen trades, this edge compounds into meaningful income.
When Cash-Secured Puts Work Best
The strategy works best under specific conditions. First, implied volatility should be elevated — selling puts when IV Rank is above 50 means you're capturing above-average premium. Second, the stock should be at or near a support level, giving the put a technical cushion. Third, institutional options flow should confirm the stock isn't in freefall — if whale flow shows heavy put buying, the smart money may know something you don't. Fourth, the stock should be one you'd genuinely want to own at the strike price. If you wouldn't buy the stock at your strike, don't sell the put.
Risk Management for Put Sellers
The primary risk is a sharp decline in the underlying stock. If you sell a $50 put and the stock drops to $30, you're assigned shares at $50 that are now worth $30 — a 40% loss before accounting for premium collected. This is why stock selection matters more than strike selection. Choose companies with strong fundamentals, institutional support (visible in whale flow data), and no imminent binary events like earnings within the expiration window.
Common Mistakes
The three mistakes I see most: selling puts on stocks you don't actually want to own (chasing premium on junk), selling when IV Rank is below 30 (not enough premium to justify the risk), and ignoring earnings dates. A 3% return sounds great until the stock gaps down 15% on an earnings miss the day before expiration. Check the calendar before every trade.
Cash-Secured Put: P&L at Expiration
Selling the $50 put for $2.00 premium. Breakeven at $48.00. Max profit is the premium collected.
This payoff diagram shows a cash-secured put sold at the $50 strike for $2.00 premium. Above $50, you keep the full $200 per contract. Your breakeven is $48.00 (strike minus premium). Below breakeven, losses increase dollar-for-dollar with the stock decline — but your effective purchase price is always lower than buying shares outright because of the premium collected.
Put Assignment Analyzer
Your put got assigned — now what? Enter your position details to see your true cost basis and what the AI recommends.
Flow Proof's AI analyzer uses live options chains and whale flow data to recommend the exact covered call strike and expiration — not just estimates.
Try AI Assignment Analyzer Free →This calculator is for educational purposes only. Results are estimates based on the inputs you provide and do not account for commissions, assignment fees, early exercise, or changes in implied volatility. Not a trade recommendation.
Putting It Into Practice
Flow Proof's Put Premium Scanner is purpose-built for identifying optimal cash-secured put entries. The scanner evaluates 25 high-IV stocks daily across 5 dimensions to produce a composite setup score.
The Scanning Process
Every day, Flow Proof fetches live IV data, historical volatility, price action relative to moving averages, drawdown from recent highs, and relative volume for each stock in your watchlist. These metrics feed into a weighted scoring algorithm that produces a grade from A (prime selling opportunity) to F (avoid). The score components are: IV Rank (28% weight), drawdown/entry timing (22%), IV/HV premium richness (25%), trend position (15%), and liquidity (10%).
AI Trade Recommendations
When you click "AI Analyze" on any scanned symbol, Flow Proof generates a specific trade recommendation including the exact strike, expiration, premium estimate, breakeven price, return on capital, and annualized return. The AI also evaluates upcoming earnings dates and warns if the position has IV crush risk. Each recommendation includes a "Skip if" condition — the scenario where the trade should be avoided.
From Scan to Execution
The workflow is: scan your watchlist, sort by setup score, analyze the top-rated symbols with AI, and identify the 1-3 best entries for the week. The scanner updates daily with fresh IV data, so the best opportunities change as market conditions evolve. Combined with the market regime dashboard (which adjusts delta targets based on VIX levels), you have a complete system for timing put entries with precision.
Related Articles
Free Guides
Start Tracking Institutional Flow
7-day free trial. Full access to whale flow tracking, AI-scored conviction signals, automated paper trading, and the put premium scanner. No credit card required.
Start Free Trial →